Custom Dashboards
A dashboard is not a report. A report tells you what happened last month, a dashboard shows you what you have to decide this week. The difference is which numbers you put on it and how you cross them. Most SMBs have data in Meta, in Stripe, in a CRM, and in a spreadsheet, but never see the four sources on the same screen. Once they do, questions appear they did not know how to formulate, and decisions appear they did not know they could make.
What we build
Dashboards in Next.js 15 over PostgreSQL, with authentication, user roles, and real-time updates on your operational data. We connect your sources (Meta, Stripe, the CRM, the internal database), normalize them once, and build the views you need on top. Every screen answers a specific business question, not the KPI list a blog post recommended.
The clearest case is the fitness coach. We built a historical view over the 1105 leads from before the agent, categorized by campaign and region, and in the first session with that view open the number that changed everything showed up: Spain converted 6.2 times more than Venezuela. That number had existed in the data for months, but nobody had seen it because there was no screen to see it on. The full case study is published.
How we work
In the discovery call we do not ask which KPIs you want. We ask which decisions you take every week and where you arrive short on information. From there the dashboard views emerge: one per decision, with the cross-cuts needed to answer it.
The first version is navigable by week two. From there we iterate: you use it, you tell us what is missing, what is noise, where the number reads wrong, and the next week we come back with the fixes. A dashboard nobody opens is wasted money, so the goal is that you look at it every day on your own.
screenshot
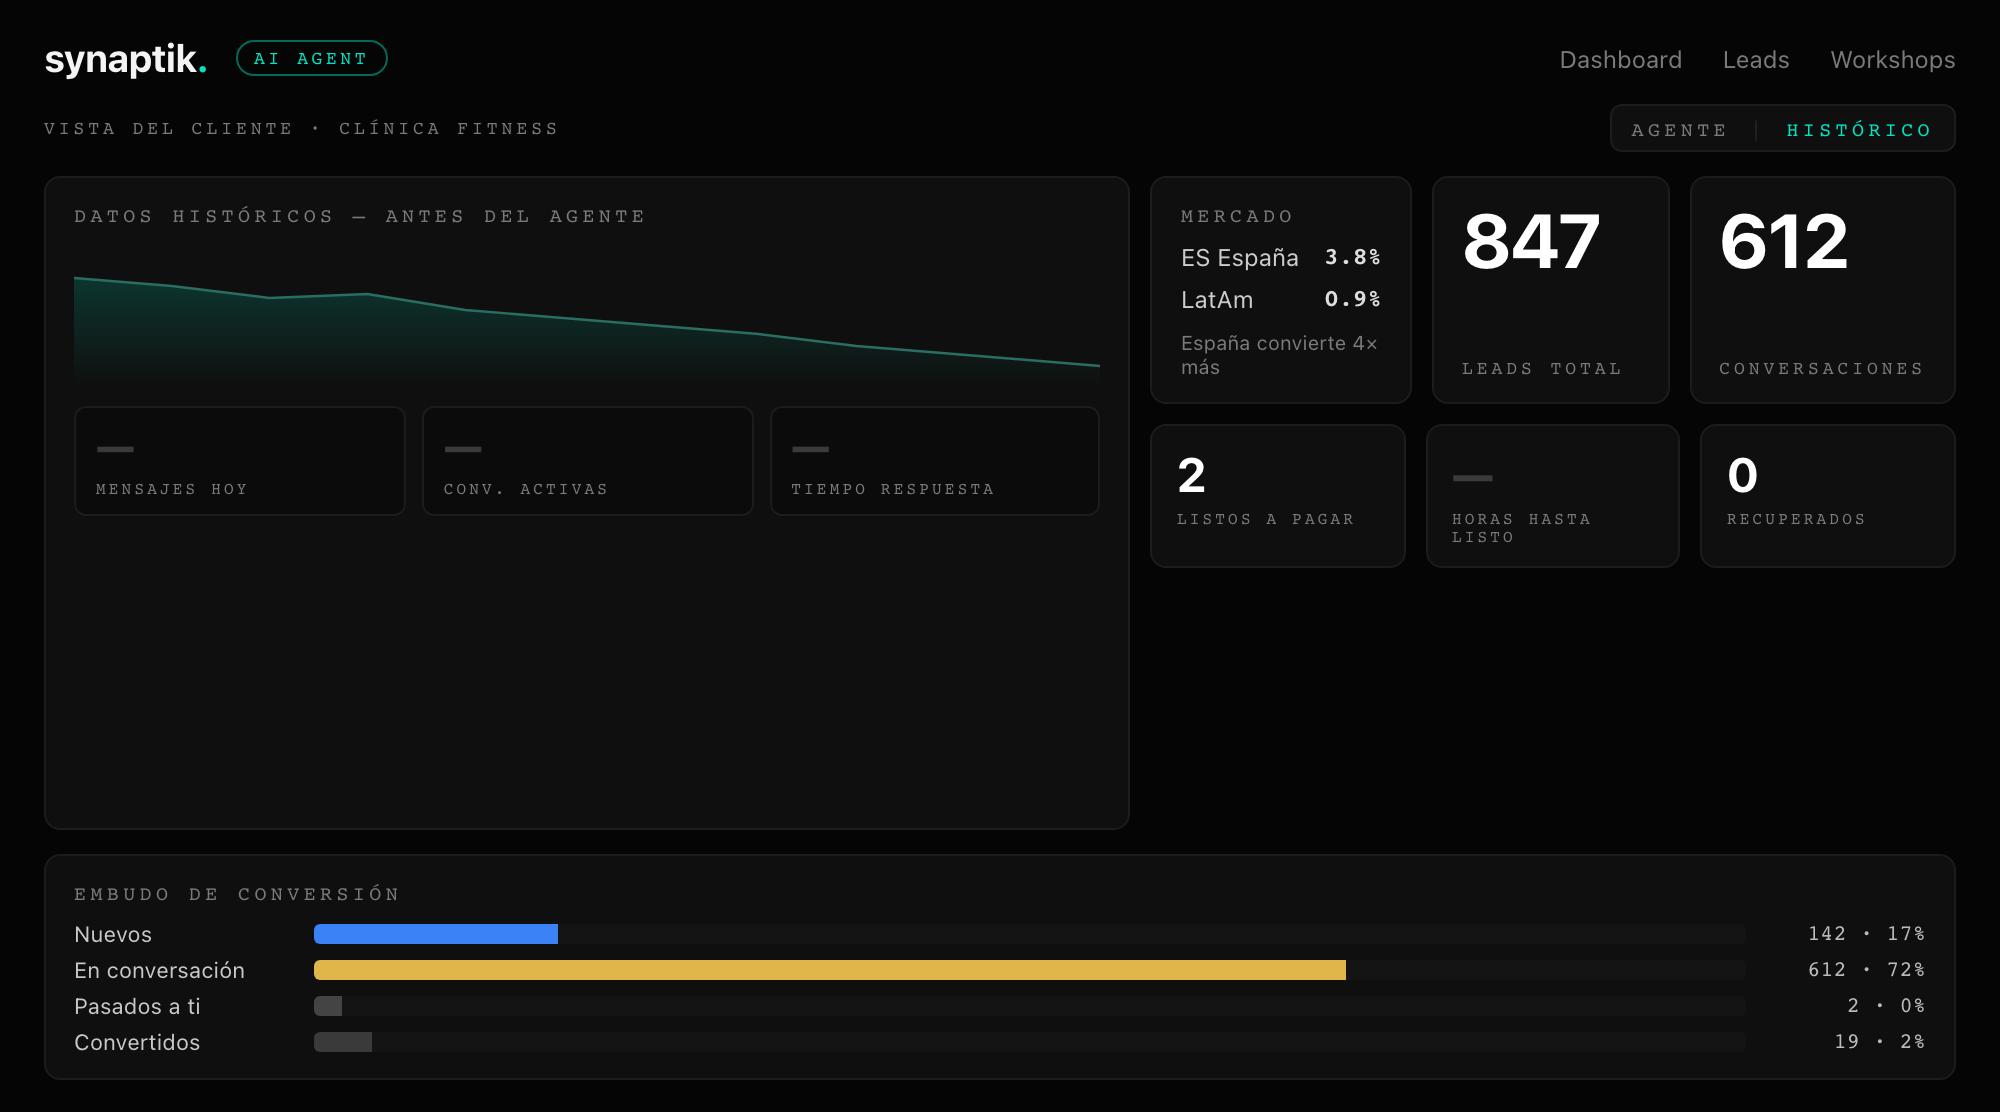
The historical view of the fitness coach dashboard: 1105 leads and the conversion comparison between Spain and Venezuela. That 6.2× showed up the first time the two markets sat on the same screen.
FAQ
Where does the dashboard pull data from?
From wherever it already lives. Meta Leads Centre, Stripe, your CRM, a PostgreSQL database, a Google Sheet, an Airtable base. We write a connector per source, normalize into a single table, and the dashboard reads from there in real time. If you add a new source later, we write another connector without touching the rest.
Can we give the team different permission levels?
Yes. The dashboard has authentication and roles: admin, operator, read-only. Each role sees the screens that fit. We default to magic links by email, but if you prefer SSO with Google Workspace or Microsoft we wire that in too.
What if the business changes and I need new views?
The first three months of support cover view changes and adding new metrics. After that we move to a monthly maintenance agreement, or you hire us by the hour when you need something specific. No forced subscription.